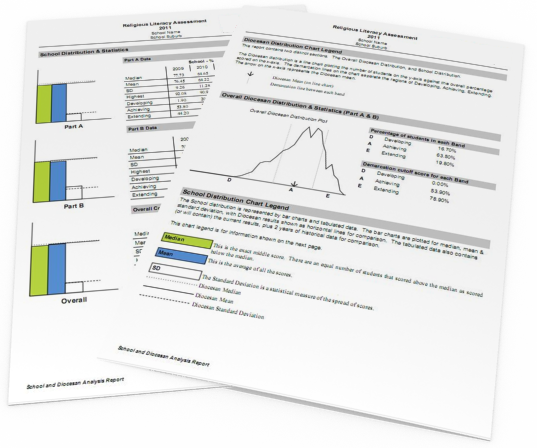
Distribution and Statistics
This 2 page report provided the users with distribution plots and statistics. Page 1 plotted the distribution of the overall score and page 2 provided statistical information on medium, mean, standard deviation as bar chart and tabulated data.
The tables also had 3 years of data for comparative analysis and also provided additional statistical items.
Context
This was part of a larger set of reports that was developed for 40 primary and secondary schools. Nearly 200Mb of reports were created for administrators, teachers and students.